Reading Your Usage
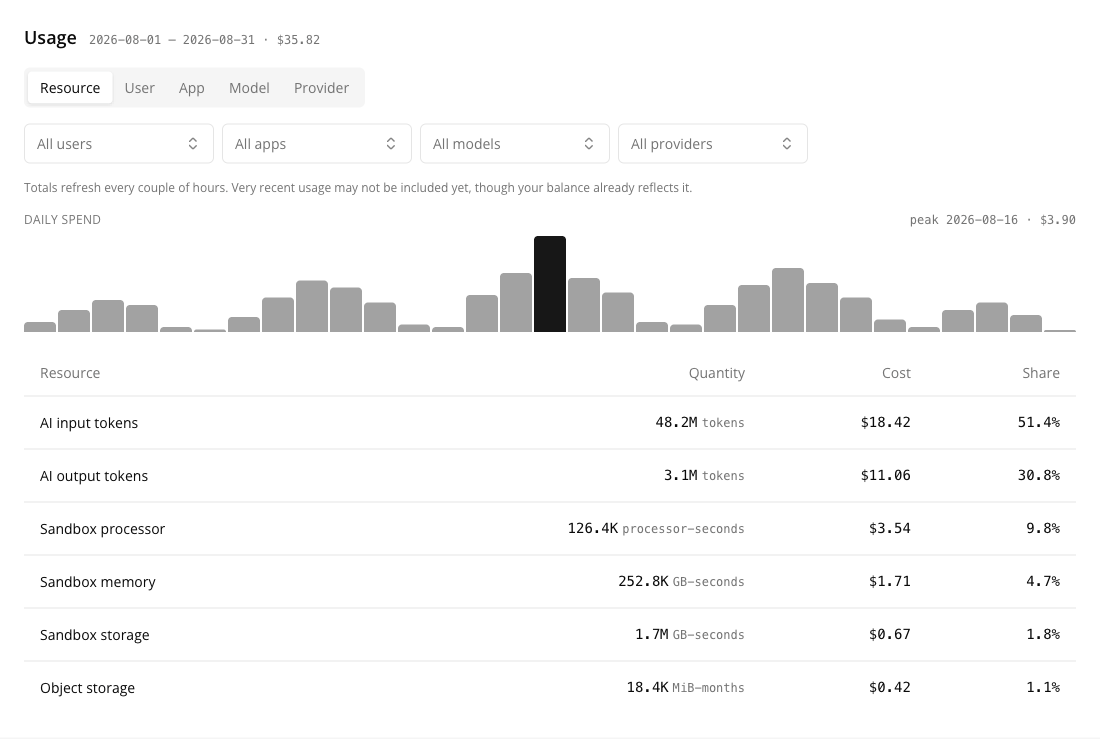
The Usage panel sits below the summary on Settings → Billing. It answers one question — what is costing this much — by re-pivoting the same period across the attributes Fours records as consumption happens.
Choose the month
The period selector at the top of the page drives both panels, so the summary and the usage table always describe the same month. It offers the last 12 months, newest first, with the current month marked (current).
Selecting a closed month shows that month’s settled figures. The credit balance above is always your balance now.
Group the period
The tab strip re-pivots the same consumption. Every pivot totals the same amount.
| Group by | Answers |
|---|---|
| Resource | What kind of thing did the money go on — tokens, sandbox, storage |
| User | Who caused it |
| App | Which Insulin app it ran under |
| Model | Which model was used |
| Provider | Which provider served it |
| Agent | Which agent or AI feature spent it |
Each row shows the cost and the row’s share of the period. Under Resource, the first figure is the Quantity, with its unit. Every other grouping mixes resources measured in different units — tokens with processor-seconds — so there the column is Tokens, input and output tokens alone, and a row with no tokens, such as sandbox or storage spend, shows a dash.
Users are shown by name. A row shows the member’s name (or their email, if their profile has no name), with their user ID beside it. Someone who is not a member of the organization — a former member, say — is shown by the email recorded with their usage, and usage recorded before emails were recorded shows the ID alone. Everyone who can open Settings → Billing sees those recorded emails.
Apps are shown by name. On the App tab a row shows the app’s name with its ID beside it. Apps are named by the same rule as your app list: an app you cannot see, such as a colleague’s private app, or one that has been deleted, reads Private or deleted app · 1a2b3c4d (the first eight characters of its ID), with its full ID still beside it. Its spend still counts.
Sandbox and storage have a provider. Under Provider, sandbox usage appears under
daytona and object storage under aws-s3, older months included.
Spend by agent
The Agent tab answers which agent is spending our credit. Each row is an agent or an AI feature, with three more columns:
| Column | Shows |
|---|---|
| Agent ID | The agent’s ID. Two agents can share a name; the ID tells them apart. |
| Type | Built-in — an agent or feature that ships with Fours — or Custom, one made in your organization |
| Level | Org for an organization agent or feature, User for one person’s own — the built-in Insulin assistant is User, because each person has their own |
Besides your agents, the rows name the AI features that run for your organization: the Console assistant, the App Builder, the Inbox, Knowledge base, and the AI features elsewhere in the Fours console — What is metered lists them. A custom agent you cannot see, such as a colleague’s personal agent, or one that has been deleted, reads Private or deleted agent · 1a2b3c4d (the first eight characters of its ID), with its full ID under Agent ID and a dash for Type and Level; its spend still counts. If Fours cannot look the names up at all, agents and apps show their IDs instead, and built-in agents keep their names.
Rows with nothing to attribute
Some consumption genuinely has no value for the dimension you picked: a scheduled job has no user, a direct API call has no app, sandbox storage has no model. Those rows are named rather than dropped —
| Grouping | The unattributed row reads |
|---|---|
| User | No user — scheduled and system runs |
| App | No app |
| Model | No model — sandbox and storage |
| Provider | No provider recorded — usage recorded without a provider |
| Agent | No agent — sandbox, storage and earlier usage — including AI usage from before agents were recorded, so an older month shows most of its spend here |
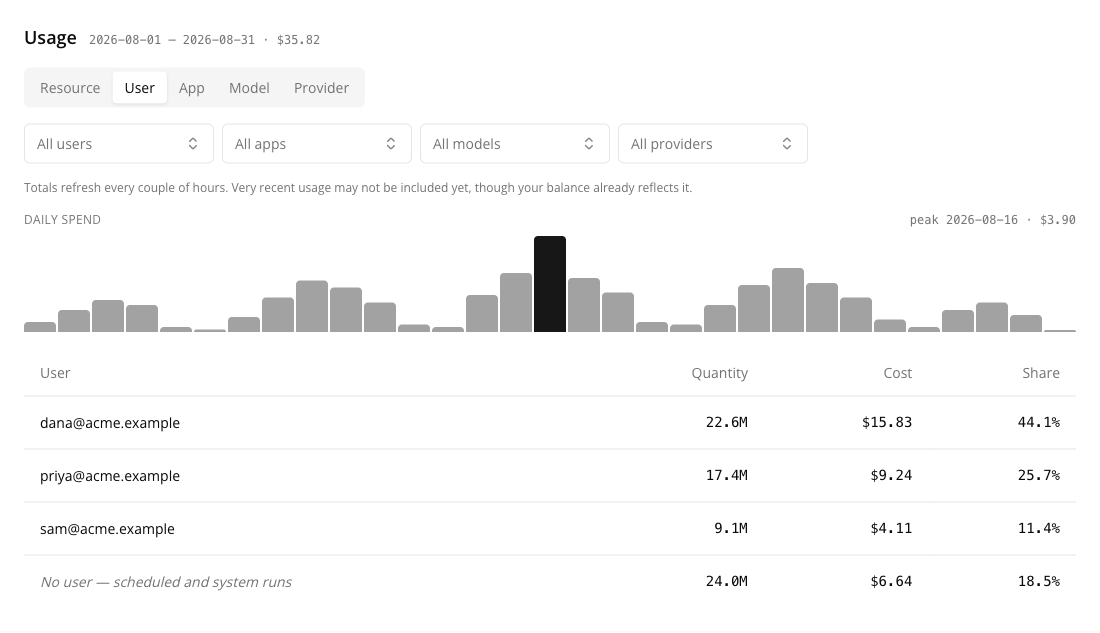
This is why the pivots reconcile. If unattributed consumption were left out, the by-user view would quietly total less than the by-resource view, and neither would match your bill.
Narrow it with filters
Five multi-select filters — Users, Apps, Agents, Models and Providers — sit under the tabs. Grouping and filtering answer different questions: grouping is what did we spend it on, filtering is what did this team spend it on.
Each filter lists every value that occurs in the period, whatever the table is grouped by, and a selection stays applied as you switch tabs. No filter ever offers someone who never used AI: the lists are built from the period’s own usage, not from your member list. An Agents or Apps choice shows its ID under its name, and typing an ID in the filter’s search finds it.
With any filter applied the panel says so, because a filtered total is a subset of the period, not the whole bill. Clear filters returns to the full period.
The daily spend chart
One bar per day of the period, with the peak day highlighted and labelled above the chart. Days with no spend render as an empty slot rather than being closed up — a chart that bridged a quiet weekend would draw a slope across spending nobody can account for. The chart follows the filters, so a filtered chart and table describe the same spend.
Why the table can look emptier than your balance
The usage breakdown is re-aggregated every couple of hours. The credit balance above it comes straight from the ledger and moves within about a minute of a request.
So this sequence is normal:
- You run something expensive.
- The Credit balance drops immediately.
- The Usage table still shows the period without it.
The panel says as much above the table. If the two disagree, the balance is the current one — the table is catching up, and nothing has been lost or double-counted.
An empty table therefore means nothing has been aggregated for this period yet, which is not the same as you have used nothing.
What this panel does not do
There is no CSV export and no per-request drill-down. The finest grain available here is a grouped row for the period. If you need the underlying detail — to reconcile a specific job or a specific day — contact support@suger.io while the consumption records are still inside their 90-day retention window.
Spotted something wrong or out of date on this page? Tell us and we'll correct it.